Cluster 50k reaction data set by Schneider et al. using TMAP
lf = tm.LSHForest(256, 128)
mh_encoder = tm.Minhash()
mhfps = [mh_encoder.from_weight_array(fp.tolist(), method="I2CWS") for fp in tqdm(ft_10k_fps)]
labels = []
# superclasses
superclasses = []

# product properties
tpsa = []
logp = []
mw = []
h_acceptors = []
h_donors = []
ring_count = []

# metals in precursors
has_Pd = []
has_Li = []
has_Mg = []
has_Al = []

for i, row in tqdm(schneider_df.iterrows(), total=len(schneider_df)):

    rxn = row["rxn"]
    labels.append(
        str(rxn)
        + "__"
        + str(rxn)
        + f"__{row['source']}"
        + f"__{rxnclass2name[row['rxn_class']]} - {row['rxn_class']}"
        + f"__{rxnclass2name[row['rxn_category']]}"
        + f"__{rxnclass2name[row['rxn_superclass']]}"
    )
    superclasses.append(int(row["rxn_superclass"]))

    precursors, products = rxn.split('>>')

    mol = Chem.MolFromSmiles(products)

    tpsa.append(Descriptors.TPSA(mol))
    logp.append(Descriptors.MolLogP(mol))
    mw.append(Descriptors.MolWt(mol))
    h_acceptors.append(Descriptors.NumHAcceptors(mol))
    h_donors.append(Descriptors.NumHDonors(mol))
    ring_count.append(Descriptors.RingCount(mol))

    has_Pd.append('Pd' in precursors)
    has_Li.append('Li' in precursors)
    has_Mg.append('Mg' in precursors)
    has_Al.append('Al' in precursors)
tpsa_ranked = stats.rankdata(np.array(tpsa) / max(tpsa)) / len(tpsa)
logp_ranked = stats.rankdata(np.array(logp) / max(logp)) / len(logp)
mw_ranked = stats.rankdata(np.array(mw) / max(mw)) / len(mw)
h_acceptors_ranked = stats.rankdata(np.array(h_acceptors) / max(h_acceptors)) / len(
    h_acceptors
)
h_donors_ranked = stats.rankdata(np.array(h_donors) / max(h_donors)) / len(h_donors)
ring_count_ranked = stats.rankdata(np.array(ring_count) / max(ring_count)) / len(
    ring_count
)
labels_groups, groups = Faerun.create_categories(superclasses)

labels_groups = [(label[0], f"{label[1]} - {rxnclass2name[str(label[1])]}") for label in labels_groups]
lf.batch_add(mhfps)
lf.index()

# Layout
cfg = tm.LayoutConfiguration()
cfg.k = 50
cfg.kc = 50
cfg.sl_scaling_min = 1.0
cfg.sl_scaling_max = 1.0
cfg.sl_repeats = 1
cfg.sl_extra_scaling_steps = 2
cfg.placer = tm.Placer.Barycenter
cfg.merger = tm.Merger.LocalBiconnected
cfg.merger_factor = 2.0
cfg.merger_adjustment = 0
cfg.fme_iterations = 1000
cfg.sl_scaling_type = tm.ScalingType.RelativeToDesiredLength
cfg.node_size = 1 / 37
cfg.mmm_repeats = 1

# Define colormaps
set1 = plt.get_cmap("Set1").colors
rainbow = plt.get_cmap("rainbow")
colors = rainbow(np.linspace(0, 1, len(set(groups))))[:, :3].tolist()
custom_cm = LinearSegmentedColormap.from_list("my_map", colors, N=len(colors))
bin_cmap = ListedColormap([set1[8], "#5400F6"], name="bin_cmap")

# Get tree coordinates
x, y, s, t, _ = tm.layout_from_lsh_forest(lf, config=cfg)
f = Faerun(clear_color="#ffffff", coords=False, view="front",)

f.add_scatter(
"ReactionAtlas",
{
    "x": x, "y": y,
    "c": [
        groups, # superclasses
        has_Pd,
        has_Li,
        has_Mg,
        has_Al,
        tpsa_ranked,
        logp_ranked,
        mw_ranked,
        h_acceptors_ranked,
        h_donors_ranked,
        ring_count_ranked,
    ],
    "labels": labels
},
shader="smoothCircle",
colormap=[
    custom_cm,
    bin_cmap,
    bin_cmap,
    bin_cmap,
    bin_cmap,
    "rainbow",
    "rainbow",
    "rainbow",
    "rainbow",
    "rainbow",
    "rainbow",

],
point_scale=2.0,
categorical=[
    True,
    True,
    True,
    True,
    True,
    False,
    False,
    False,
    False,
    False,
    False,
],
has_legend=True,
legend_labels=[
    labels_groups,
    [(0, "No"), (1, "Yes")],
    [(0, "No"), (1, "Yes")],
    [(0, "No"), (1, "Yes")],
    [(0, "No"), (1, "Yes")],
    None,
    None,
    None,
    None,
    None,
    None,
],
selected_labels=["SMILES", "SMILES", "Patent ID",  "Named Reaction", "Category", "Superclass"],
series_title=[
    "Superclass",
    "Pd",
    "Li",
    "Mg",
    "Al",
    "TPSA",
    "logP",
    "Mol Weight",
    "H Acceptors",
    "H Donors",
    "Ring Count",
],
max_legend_label=[
    None,
    None,
    None,
    None,
    None,
    str(round(max(tpsa))),
    str(round(max(logp))),
    str(round(max(mw))),
    str(round(max(h_acceptors))),
    str(round(max(h_donors))),
    str(round(max(ring_count))),
],
min_legend_label=[
    None,
    None,
    None,
    None,
    None,
    str(round(min(tpsa))),
    str(round(min(logp))),
    str(round(min(mw))),
    str(round(min(h_acceptors))),
    str(round(min(h_donors))),
    str(round(min(ring_count))),
],
title_index=2,
legend_title="",
)

f.add_tree("reactiontree", {"from": s, "to": t}, point_helper="ReactionAtlas")
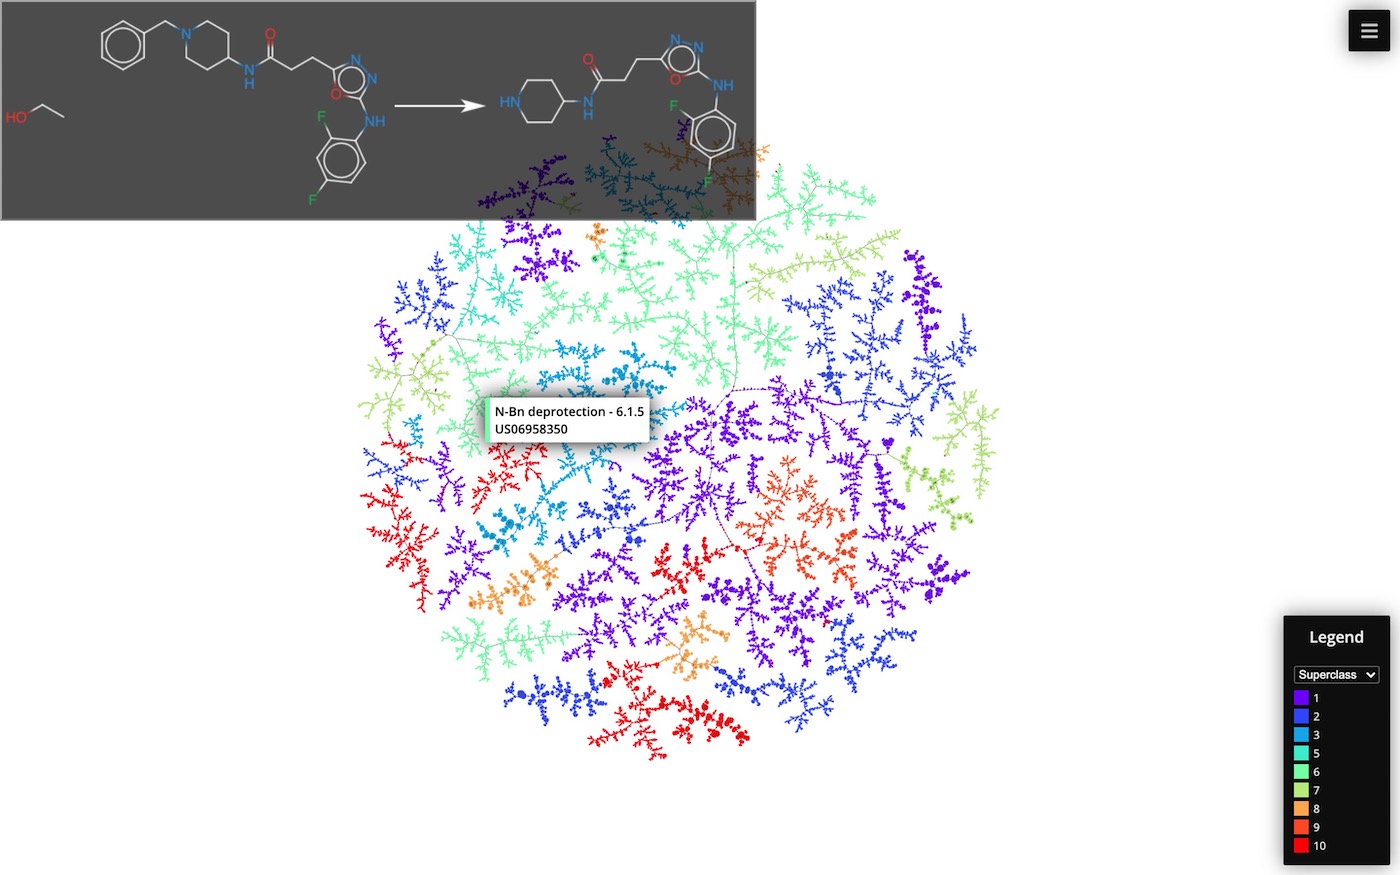
Interative version
An interactive reaction atlas made from the same data set and fingerprint can be found here (link).